
![]()
![]()
Package overview
CohortCharacteristics contains functions for summarising characteristics of cohorts of patients identified in an OMOP CDM dataset. Once a cohort table has been created, CohortCharacteristics provides a number of functions to help provide a summary of the characteristics of the individuals within the cohort.
#> To cite CohortCharacteristics package in publications please use:
#>
#>   Du M, Prats-Uribe A, Mercadé-Besora N, Lopez-Guell K, Guo Y,
#>   Alcalde-Herraiz M, Chen X, Delmestri A, Man WY, Duarte-Salles T,
#>   Palomar A, Giuliodori A, Brađašević E, Jezidžić A, Bräuner E, Bruun
#>   S, Verhamme K, Mosseveld M, Brash JT, Vojinovic D, Kaczmarczyk I,
#>   Mendez A, Rijnbeek P, Prieto-Alhambra D, Burn E, Català M (2026).
#>   "CohortCharacteristics: an R package for population characterisation
#>   in observational studies using the OMOP common data model." _European
#>   Journal of Epidemiology_. doi:10.1007/s10654-025-01352-4
#>   <https://doi.org/10.1007/s10654-025-01352-4>.
#>
#> A BibTeX entry for LaTeX users is
#>
#>   @Article{,
#>     title = {CohortCharacteristics: an R package for population characterisation in observational studies using the OMOP common data model},
#>     author = {Mike Du and Albert Prats-Uribe and Núria Mercadé-Besora and Kim Lopez-Guell and Yuchen Guo and Marta Alcalde-Herraiz and Xihang Chen and Antonella Delmestri and Wai Yi Man and Talita Duarte-Salles and Anna Palomar and Agustina Giuliodori and Emanuel Brađašević and Antea Jezidžić and Elvira Bräuner and Susanne Bruun and Katia Verhamme and Mees Mosseveld and James T. Brash and Dina Vojinovic and Isabella Kaczmarczyk and Akram Mendez and Peter Rijnbeek and Daniel Prieto-Alhambra and Edward Burn and Martí Català},
#>     journal = {European Journal of Epidemiology},
#>     year = {2026},
#>     doi = {10.1007/s10654-025-01352-4},
#>   }
Package installation
You can install the latest version of CohortCharacteristics from CRAN:
install.packages("CohortCharacteristics")Or install the development version from github:
install.packages("pak")
pak::pkg_install("darwin-eu/CohortCharacteristics")Content
The package contain three types of functions:
-
summarise* type functions. These functions produce
standard output. See omopgenerics for more information on this standardised output format. These functions are the ones that do the work in terms of extracting the necessary data from the cdm and summarising it. - table* type functions. These functions work with the output of the summarise ones. They will produce a table visualisation created using the visOmopResults package.
- plot* type functions. These functions work with the output of the summarise ones. They will produce a plot visualisation created using the visOmopResults package.
Examples
Mock data
Although the package provides some simple mock data for testing (mockCohortCharacteristics()), for these examples we will use the GiBleed dataset that can be downloaded using the omock package that will give us some synthetic data results.
library(omock)
library(dplyr, warn.conflicts = FALSE)
library(DrugUtilisation)

cdm <- mockCdmFromDataset(datasetName = "GiBleed", source = "duckdb")
Let’s create a simple cohort:
cdm <- generateIngredientCohortSet(cdm = cdm, name = "my_cohort", ingredient = c("warfarin", "acetaminophen"))Cohort counts
We can get counts using the function summariseCohortCount():
result <- summariseCohortCount(cdm$my_cohort)
result |>
  glimpse()
#> Rows: 4
#> Columns: 13
#> $ result_id        <int> 1, 1, 1, 1
#> $ cdm_name         <chr> "GiBleed", "GiBleed", "GiBleed", "GiBleed"
#> $ group_name       <chr> "cohort_name", "cohort_name", "cohort_name", "cohort_…
#> $ group_level      <chr> "acetaminophen", "acetaminophen", "warfarin", "warfar…
#> $ strata_name      <chr> "overall", "overall", "overall", "overall"
#> $ strata_level     <chr> "overall", "overall", "overall", "overall"
#> $ variable_name    <chr> "Number records", "Number subjects", "Number records"…
#> $ variable_level   <chr> NA, NA, NA, NA
#> $ estimate_name    <chr> "count", "count", "count", "count"
#> $ estimate_type    <chr> "integer", "integer", "integer", "integer"
#> $ estimate_value   <chr> "13907", "2679", "137", "137"
#> $ additional_name  <chr> "overall", "overall", "overall", "overall"
#> $ additional_level <chr> "overall", "overall", "overall", "overall"
You can easily create a table using the associated table function, tableCohortCount():
tableCohortCount(result, type = "flextable")
We could create a simple plot with plotCohortCount():
result |>
  filter(variable_name == "Number subjects") |>
  plotCohortCount(x = "cohort_name", colour = "cohort_name")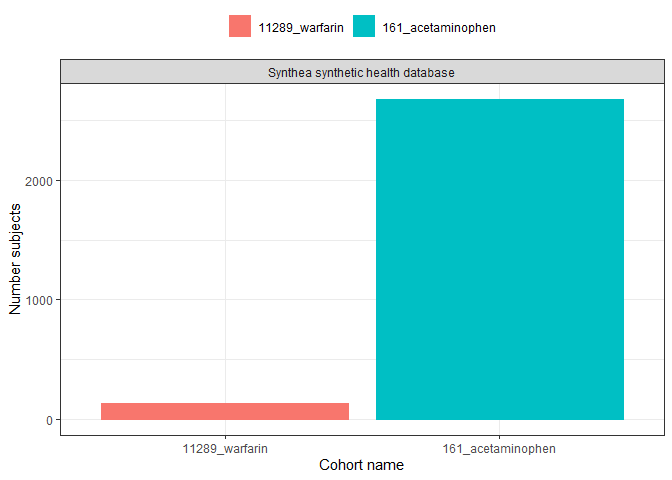
All the other function work using the same dynamic, first summarise, then plot/table.
Cohort attrition
result <- summariseCohortAttrition(cdm$my_cohort)
tableCohortAttrition(result, type = "flextable")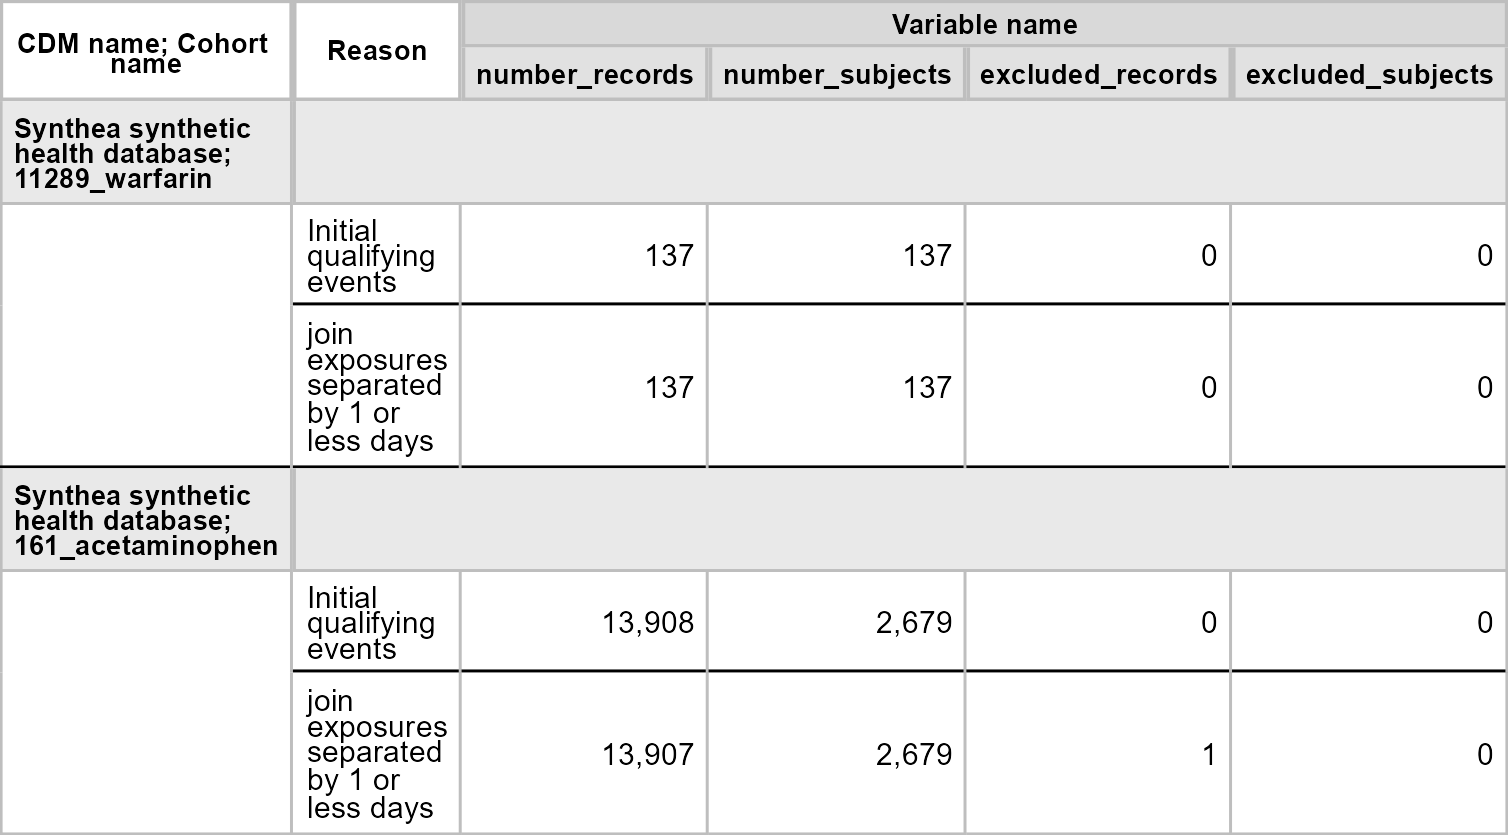
result |>
  filter(group_level == "161_acetaminophen") |>
  plotCohortAttrition()
Characteristics
result <- summariseCharacteristics(cdm$my_cohort)
tableCharacteristics(result, type = "flextable")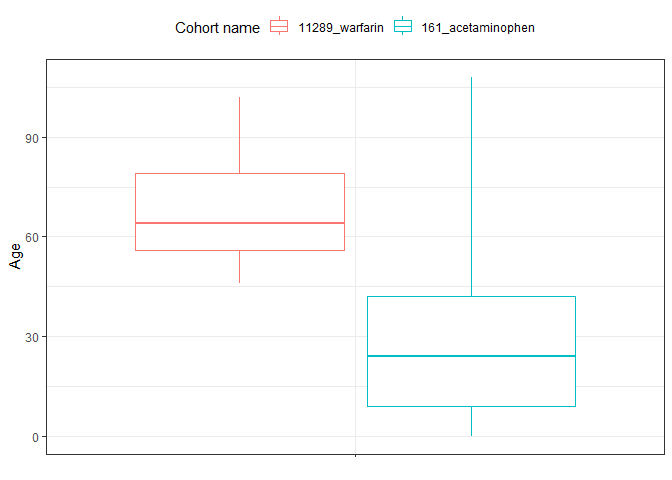
result |>
  filter(variable_name == "Age") |>
  plotCharacteristics(plotType = "boxplot", colour = "cohort_name")
Timing between cohorts
result <- summariseCohortTiming(cdm$my_cohort)
tableCohortTiming(result, type = "flextable")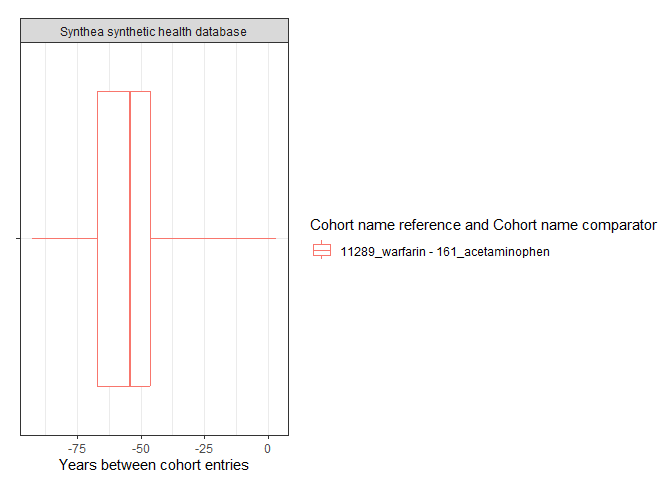
plotCohortTiming(
  result,
  uniqueCombinations = TRUE,
  facet = "cdm_name",
  colour = c("cohort_name_reference", "cohort_name_comparator"),
  timeScale = "years"
)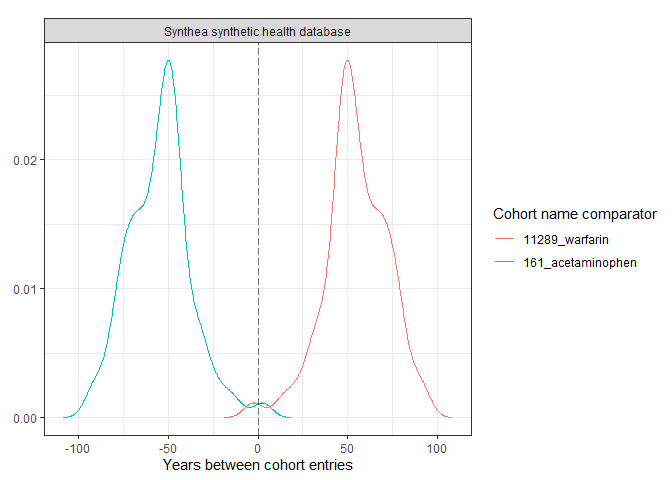
plotCohortTiming(
  result,
  plotType = "densityplot",
  uniqueCombinations = FALSE,
  facet = "cdm_name",
  colour = c("cohort_name_comparator"),
  timeScale = "years"
)
Overlap between cohort
result <- summariseCohortOverlap(cdm$my_cohort)
tableCohortOverlap(result, type = "flextable")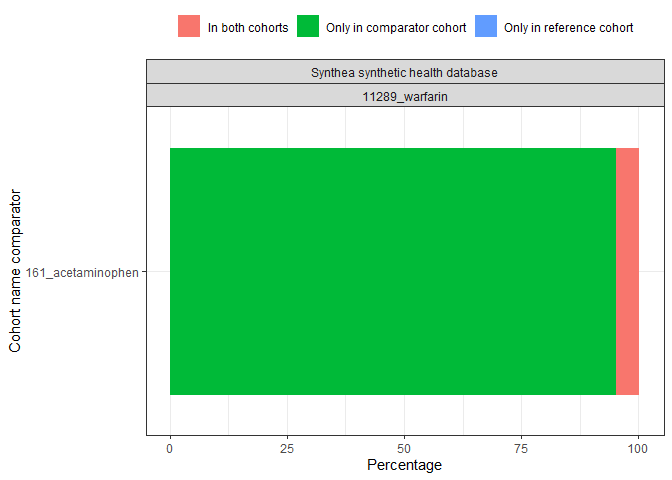
plotCohortOverlap(result, uniqueCombinations = TRUE)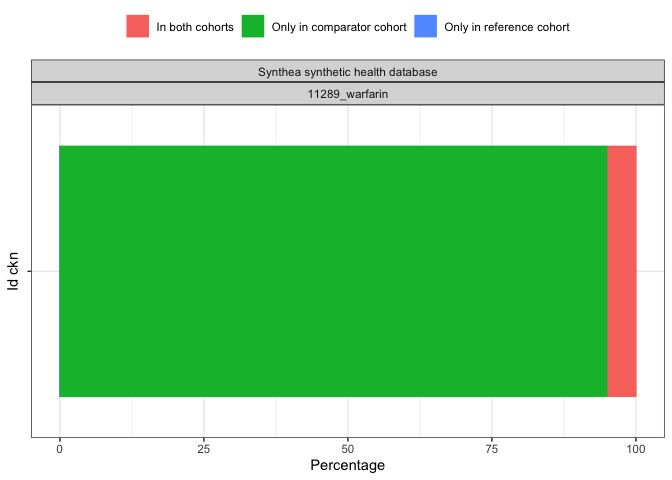
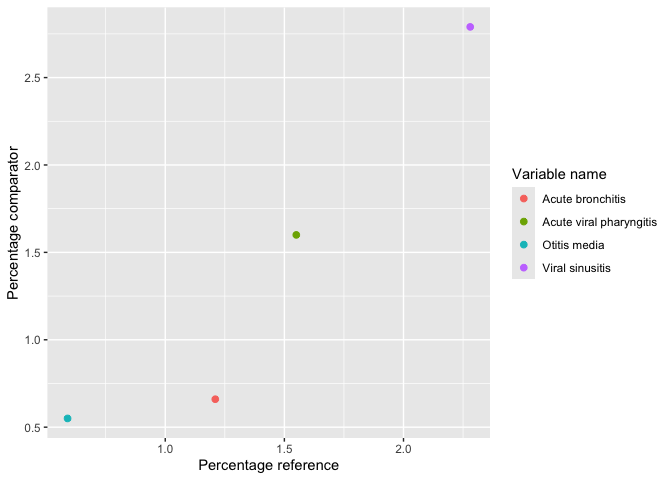
Large scale characteristics
result <- cdm$my_cohort |>
  summariseLargeScaleCharacteristics(
    window = list(c(-90, -1), c(0, 0), c(1, 90)),
    eventInWindow = "condition_occurrence"
  )
tableTopLargeScaleCharacteristics(result, type = "flextable")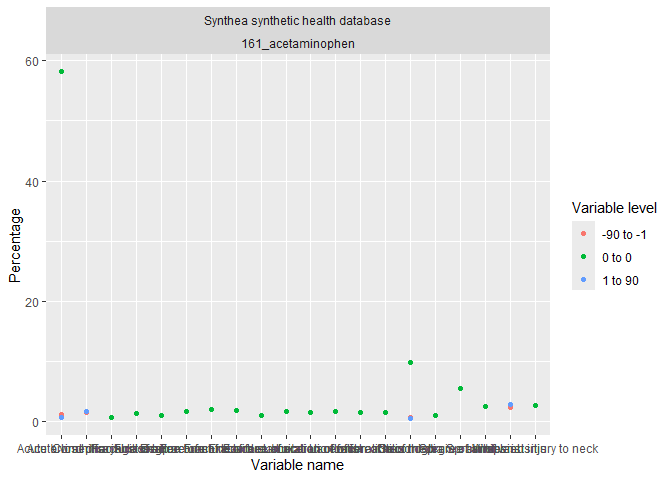
result |>
  omopgenerics::filterGroup(cohort_name == "acetaminophen") |>
  plotLargeScaleCharacteristics()
result |>
  omopgenerics::filterGroup(cohort_name == "acetaminophen") |>
  plotComparedLargeScaleCharacteristics(
    reference = "-90 to -1", colour = "variable_level"
  )
Recommendations
Although it is technically possible, we do not recommend to pipe table or plot functions with the summarise ones. The main reason is that summarise functions take some time to run, a large scale characterisation in a big cdm object can take a few hours. If we pipe the output to a table/plot function we loose the summarise result object. In fact, some times we would send code around to be ran in others database and what we want to export is the summarised_result objects and not the table or plot which we would like to build after compiling results from different cdm objects.
Not recommended:
cdm$my_cohort |>
  summariseCharacteristics() |>
tableCharacteristics()Recommended:
x <- summariseCharacteristics(cdm$my_cohort)

tableCharacteristics(x)