Introduction
Cohorts are often a key component in studies that use the OMOP CDM. They may be created to represent various clinical events of interest and we often use cohorts in combination, whether it is to identify outcomes among people with an exposure of interest, report baseline comorbidites among a certain study population, or for many other possible reasons.
Cohorts have a particular format in the OMOP CDM, which we can see
for two cohort tables created by the mockPatientProfiles()
function provided by PatientProfiles, which mimics a database in the
OMOP CDM format. We can see the first cohort table contains 2 cohorts
while the second contains 3 cohorts.
library(PatientProfiles)
library(dplyr)
library(ggplot2)

cdm <- mockPatientProfiles(numberIndividuals = 1000, source = "duckdb")

cdm$cohort1 |>
  glimpse()
## Rows: ??
## Columns: 4
## $ cohort_definition_id <int> 1, 3, 1, 2, 3, 2, 2, 2, 2, 3, 2, 2, 1, 1, 1, 3, 2…
## $ subject_id <int> 159, 328, 495, 255, 114, 109, 753, 919, 115, 121,…
## $ cohort_start_date <date> 1957-12-08, 1954-10-26, 1969-09-03, 1984-04-13, …
## $ cohort_end_date <date> 1960-07-31, 1974-02-08, 1969-11-02, 1984-07-01, …
settings(cdm$cohort1)## # A tibble: 3 × 2
## cohort_definition_id cohort_name
## <int> <chr>
## 1 1 cohort_1
## 2 2 cohort_2
## 3 3 cohort_3
cdm$cohort2 |>
  glimpse()
## Rows: ??
## Columns: 4
## $ cohort_definition_id <int> 1, 3, 1, 2, 2, 3, 1, 3, 1, 3, 2, 1, 3, 3, 3, 1, 1…
## $ subject_id <int> 569, 69, 171, 193, 742, 734, 242, 662, 666, 565, …
## $ cohort_start_date <date> 1916-06-30, 1984-01-16, 1930-04-12, 1926-07-18, …
## $ cohort_end_date <date> 1920-07-10, 1994-03-27, 1930-05-05, 1931-10-14, …
settings(cdm$cohort2)## # A tibble: 3 × 2
## cohort_definition_id cohort_name
## <int> <chr>
## 1 1 cohort_1
## 2 2 cohort_2
## 3 3 cohort_3Identifying cohort intersections
PatientProfiles provides four functions for identifying cohort
intersections (the presence of an individual in two cohorts). The first
addCohortIntersectFlag() adds a flag of whether someone
appeared in the other cohort during a time window. The second,
addCohortIntersectCount(), counts the number of times
someone appeared in the other cohort in the window. A third,
addCohortIntersectDate(), adds the date when the
intersection occurred. And the fourth,
addCohortIntersectDays(), adds the number of days to the
intersection.
We can see each of these below. Note that they add variables to our cohort table of interest, and identify intersections over a given window. As we can see, if our target cohort table contains multiple cohorts then by default these functions will add one new variable per cohort.
Let’s start by adding flag and count variables using a window of 180 days before to 180 days after the cohort start date in our table of interest. By default the cohort start date of our cohort of interest will be used as the index date, with the cohort start to cohort end date of the target cohort then used to check for an intersection.
cdm$cohort1 |>
  addCohortIntersectFlag(
    indexDate = "cohort_start_date",
    targetCohortTable = "cohort2",
    targetStartDate = "cohort_start_date",
    targetEndDate = "cohort_end_date",
    window = list(c(-180, 180))
  ) |>
  glimpse()
## Rows: ??
## Columns: 7
## $ cohort_definition_id <int> 1, 3, 2, 2, 2, 1, 1, 1, 3, 1, 2, 3, 1, 2, 2, 2, 3…
## $ subject_id <int> 495, 114, 919, 130, 317, 538, 307, 578, 849, 686,…
## $ cohort_start_date <date> 1969-09-03, 1962-12-27, 1963-06-02, 1972-03-09, …
## $ cohort_end_date <date> 1969-11-02, 1967-07-03, 1965-03-06, 1978-01-10, …
## $ cohort_2_m180_to_180 <dbl> 0, 0, 0, 0, 0, 0, 0, 0, 0, 0, 0, 1, 0, 0, 0, 0, 0…
## $ cohort_3_m180_to_180 <dbl> 1, 1, 0, 1, 1, 1, 0, 1, 1, 0, 1, 0, 0, 0, 1, 0, 1…
## $ cohort_1_m180_to_180 <dbl> 0, 0, 1, 0, 0, 0, 1, 0, 0, 1, 0, 0, 1, 1, 0, 1, 0…
cdm$cohort1 |>
  addCohortIntersectCount(
    indexDate = "cohort_start_date",
    targetCohortTable = "cohort2",
    targetStartDate = "cohort_start_date",
    targetEndDate = "cohort_end_date",
    window = list(c(-180, 180))
  ) |>
  glimpse()
## Rows: ??
## Columns: 7
## $ cohort_definition_id <int> 1, 3, 2, 2, 2, 1, 1, 1, 3, 1, 2, 3, 1, 2, 2, 2, 3…
## $ subject_id <int> 495, 114, 919, 130, 317, 538, 307, 578, 849, 686,…
## $ cohort_start_date <date> 1969-09-03, 1962-12-27, 1963-06-02, 1972-03-09, …
## $ cohort_end_date <date> 1969-11-02, 1967-07-03, 1965-03-06, 1978-01-10, …
## $ cohort_1_m180_to_180 <dbl> 0, 0, 1, 0, 0, 0, 1, 0, 0, 1, 0, 0, 1, 1, 0, 1, 0…
## $ cohort_2_m180_to_180 <dbl> 0, 0, 0, 0, 0, 0, 0, 0, 0, 0, 0, 1, 0, 0, 0, 0, 0…
## $ cohort_3_m180_to_180 <dbl> 1, 1, 0, 1, 1, 1, 0, 1, 1, 0, 1, 0, 0, 0, 1, 0, 1…Next we can add the date of the intersection and the days to the intersection. When identifying these variables we use only one date in our target table, which by default will be the cohort start date. In addition by default the first intersection that occurs within our window will be used.
cdm$cohort1 |>
  addCohortIntersectDate(
    indexDate = "cohort_start_date",
    targetCohortTable = "cohort2",
    targetDate = "cohort_start_date",
    window = list(c(-180, 180)),
    order = "first"
  ) |>
  glimpse()
## Rows: ??
## Columns: 7
## $ cohort_definition_id <int> 1, 3, 1, 2, 3, 2, 2, 2, 2, 3, 2, 2, 1, 1, 1, 3, 2…
## $ subject_id <int> 159, 328, 495, 255, 114, 109, 753, 919, 115, 121,…
## $ cohort_start_date <date> 1957-12-08, 1954-10-26, 1969-09-03, 1984-04-13, …
## $ cohort_end_date <date> 1960-07-31, 1974-02-08, 1969-11-02, 1984-07-01, …
## $ cohort_3_m180_to_180 <date> NA, NA, NA, NA, NA, NA, NA, NA, NA, NA, NA, NA, …
## $ cohort_1_m180_to_180 <date> NA, NA, NA, NA, NA, NA, NA, NA, NA, NA, NA, NA, …
## $ cohort_2_m180_to_180 <date> NA, NA, NA, NA, NA, NA, NA, NA, NA, NA, NA, NA, …
cdm$cohort1 |>
  addCohortIntersectDays(
    indexDate = "cohort_start_date",
    targetCohortTable = "cohort2",
    targetDate = "cohort_start_date",
    window = list(c(-180, 180)),
    order = "first"
  ) |>
  glimpse()
## Rows: ??
## Columns: 7
## $ cohort_definition_id <int> 1, 3, 1, 2, 3, 2, 2, 2, 2, 3, 2, 2, 1, 1, 1, 3, 2…
## $ subject_id <int> 159, 328, 495, 255, 114, 109, 753, 919, 115, 121,…
## $ cohort_start_date <date> 1957-12-08, 1954-10-26, 1969-09-03, 1984-04-13, …
## $ cohort_end_date <date> 1960-07-31, 1974-02-08, 1969-11-02, 1984-07-01, …
## $ cohort_3_m180_to_180 <dbl> NA, NA, NA, NA, NA, NA, NA, NA, NA, NA, NA, NA, N…
## $ cohort_1_m180_to_180 <dbl> NA, NA, NA, NA, NA, NA, NA, NA, NA, NA, NA, NA, N…
## $ cohort_2_m180_to_180 <dbl> NA, NA, NA, NA, NA, NA, NA, NA, NA, NA, NA, NA, N…Options for identifying cohort intersection
To consider the impact of the different options we can choose when identifying cohort intersections let´s consider a toy example with a single patient with common cold (diagnosed on the 1st February 2020 and ending on the 15th February 2020). This person had two records for aspirin, one ending shortly before their start date for common cold and the other starting during their record for common cold.
common_cold <- tibble(
  cohort_definition_id = 1,
  subject_id = 1,
  cohort_start_date = as.Date("2020-02-01"),
  cohort_end_date = as.Date("2020-02-15")
)

aspirin <- tibble(
  cohort_definition_id = c(1, 1),
  subject_id = c(1, 1),
  cohort_start_date = as.Date(c("2020-01-01", "2020-02-10")),
  cohort_end_date = as.Date(c("2020-01-28", "2020-03-15"))
)
We can visualise what this person’s timeline looks like.
bind_rows(
  common_cold |> mutate(cohort = "common cold"),
  aspirin |> mutate(cohort = "aspirin")
) |>
  mutate(record = as.character(row_number())) |>
  ggplot() +
  geom_segment(
    aes(
      x = cohort_start_date,
      y = cohort,
      xend = cohort_end_date,
      yend = cohort, col = cohort, fill = cohort
    ),
    size = 4.5, alpha = .5
  ) +
  geom_point(aes(x = cohort_start_date, y = cohort, color = cohort), size = 4) +
  geom_point(aes(x = cohort_end_date, y = cohort, color = cohort), size = 4) +
  ylab("") +
  xlab("") +
  theme_minimal() +
  theme(legend.position = "none")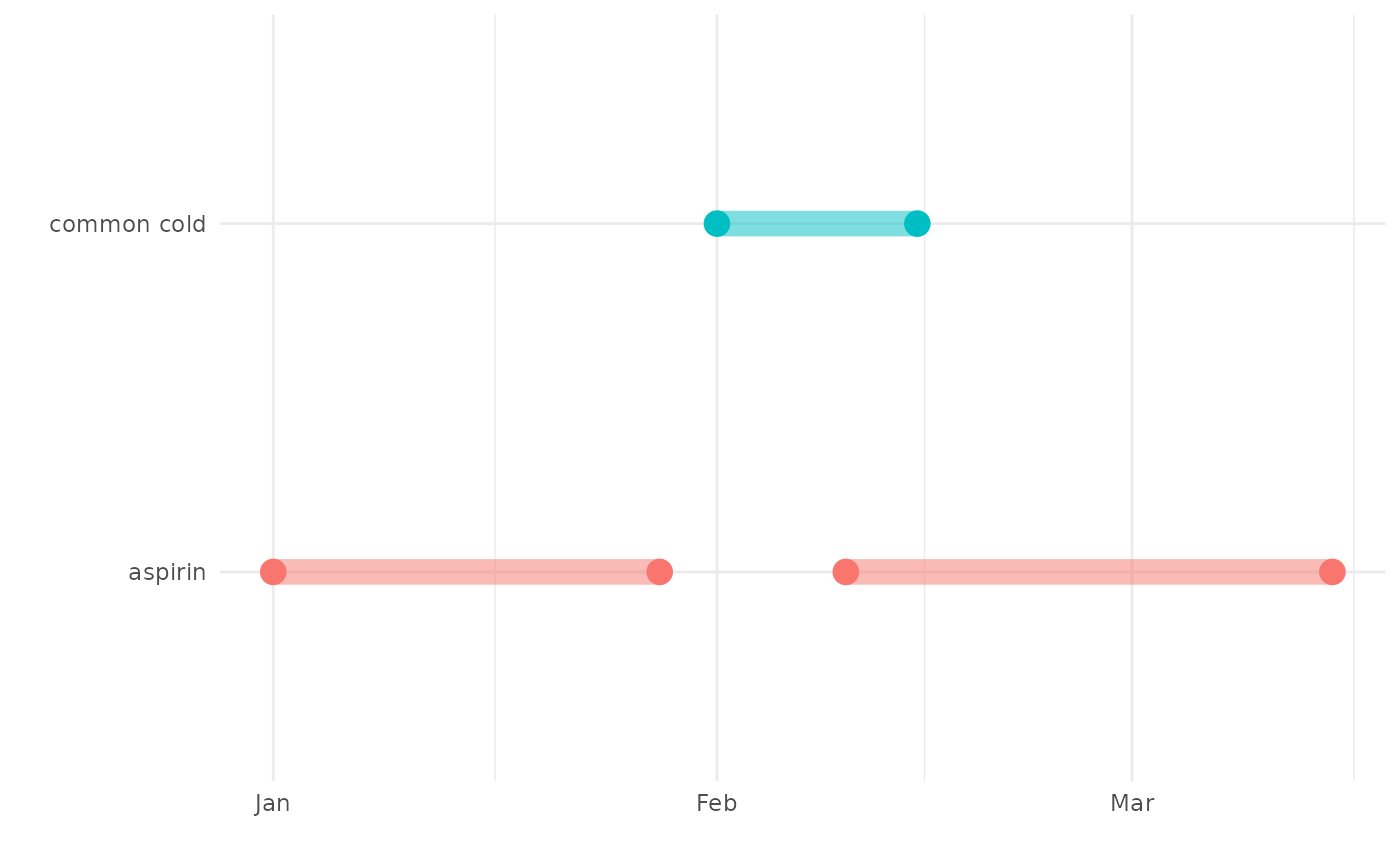
Whether we consider there to be a cohort intersection between the common cold and aspirin cohorts will depend on what options we choose. To see this let’s first create a cdm reference containing our example.
cdm <- mockPatientProfiles(
  cohort1 = common_cold,
  cohort2 = aspirin,
  numberIndividuals = 2,
  source = "duckdb"
)
If we consider the intersection relative to the cohort start date for common cold with a window of 0 to 0 (ie only the index date) then no intersection will be identified as the individual did not have an ongoing record for aspirin on that date.
cdm$cohort1 |>
  addCohortIntersectFlag(
    targetCohortTable = "cohort2",
    indexDate = "cohort_start_date",
    targetStartDate = "cohort_start_date",
    targetEndDate = "cohort_end_date",
    window = list(c(0, 0)),
  ) |>
  glimpse()
## Rows: ??
## Columns: 5
## $ cohort_definition_id <int> 1
## $ subject_id <int> 1
## $ cohort_start_date <date> 2020-02-01
## $ cohort_end_date <date> 2020-02-15
## $ cohort_1_0_to_0 <dbl> 0We could, however, change the index date to cohort end date in which case an intersection would be found.
cdm$cohort1 |>
  addCohortIntersectFlag(
    targetCohortTable = "cohort2",
    indexDate = "cohort_end_date",
    targetStartDate = "cohort_start_date",
    targetEndDate = "cohort_end_date",
    window = list(c(0, 0))
  ) |>
  glimpse()
## Rows: ??
## Columns: 5
## $ cohort_definition_id <int> 1
## $ subject_id <int> 1
## $ cohort_start_date <date> 2020-02-01
## $ cohort_end_date <date> 2020-02-15
## $ cohort_1_0_to_0 <dbl> 1Or we could also extend the window to include more time before or after which in both cases would lead to cohort intersections being found.
cdm$cohort1 |>
  addCohortIntersectFlag(
    targetCohortTable = "cohort2",
    indexDate = "cohort_start_date",
    targetStartDate = "cohort_start_date",
    targetEndDate = "cohort_end_date",
    window = list(c(-90, 90)),
  ) |>
  glimpse()
## Rows: ??
## Columns: 5
## $ cohort_definition_id <int> 1
## $ subject_id <int> 1
## $ cohort_start_date <date> 2020-02-01
## $ cohort_end_date <date> 2020-02-15
## $ cohort_1_m90_to_90 <dbl> 1With a window of 90 days before to 90 days after cohort start, the person would have a count of two cohort intersections.
cdm$cohort1 |>
  addCohortIntersectCount(
    targetCohortTable = "cohort2",
    indexDate = "cohort_start_date",
    targetStartDate = "cohort_start_date",
    targetEndDate = "cohort_end_date",
    window = list(c(-90, 90)),
  ) |>
  glimpse()
## Rows: ??
## Columns: 5
## $ cohort_definition_id <int> 1
## $ subject_id <int> 1
## $ cohort_start_date <date> 2020-02-01
## $ cohort_end_date <date> 2020-02-15
## $ cohort_1_m90_to_90 <dbl> 2With this same window, if we add the first cohort intersect date we will get the start date of the first record of aspirin.
cdm$cohort1 |>
  addCohortIntersectDate(
    targetCohortTable = "cohort2",
    indexDate = "cohort_start_date",
    targetDate = "cohort_start_date",
    window = list(c(-90, 90)),
    order = "first"
  ) |>
  glimpse()
## Rows: ??
## Columns: 5
## $ cohort_definition_id <int> 1
## $ subject_id <int> 1
## $ cohort_start_date <date> 2020-02-01
## $ cohort_end_date <date> 2020-02-15
## $ cohort_1_m90_to_90 <date> 2020-01-01But if we instead set order to last, we get the start date of the second record of aspirin.
cdm$cohort1 |>
  addCohortIntersectDate(
    targetCohortTable = "cohort2",
    indexDate = "cohort_start_date",
    targetDate = "cohort_start_date",
    window = list(c(-90, 90)),
    order = "last"
  ) |>
  glimpse()
## Rows: ??
## Columns: 5
## $ cohort_definition_id <int> 1
## $ subject_id <int> 1
## $ cohort_start_date <date> 2020-02-01
## $ cohort_end_date <date> 2020-02-15
## $ cohort_1_m90_to_90 <date> 2020-02-10Naming conventions for new variables
One last option relates to the naming convention used to for the new variables.
cdm$cohort1 |>
  addCohortIntersectDate(
    targetCohortTable = "cohort2",
    indexDate = "cohort_start_date",
    targetDate = "cohort_start_date",
    window = list(c(-90, 90)),
    order = "last",
    nameStyle = "{cohort_name}_{window_name}"
  ) |>
  glimpse()
## Rows: ??
## Columns: 5
## $ cohort_definition_id <int> 1
## $ subject_id <int> 1
## $ cohort_start_date <date> 2020-02-01
## $ cohort_end_date <date> 2020-02-15
## $ cohort_1_m90_to_90 <date> 2020-02-10We can instead choose a specific name (but this will only work if only one new variable will be added, otherwise we will get an error to avoid duplicate names).
cdm$cohort1 |>
  addCohortIntersectDate(
    targetCohortTable = "cohort2",
    indexDate = "cohort_start_date",
    targetDate = "cohort_start_date",
    window = list(c(-90, 90)),
    order = "last",
    nameStyle = "my_new_variable"
  ) |>
  glimpse()
## Rows: ??
## Columns: 5
## $ cohort_definition_id <int> 1
## $ subject_id <int> 1
## $ cohort_start_date <date> 2020-02-01
## $ cohort_end_date <date> 2020-02-15
## $ my_new_variable <date> 2020-02-10In the other direction we could also include the estimate type in the name. This will be useful, for example, if we’re adding multiple different types of intersection values.
cdm$cohort1 |>
  addCohortIntersectDate(
    targetCohortTable = "cohort2",
    indexDate = "cohort_start_date",
    targetDate = "cohort_start_date",
    window = list(c(-90, 90)),
    order = "last",
    nameStyle = "{cohort_name}_{window_name}_{value}"
  ) |>
  addCohortIntersectDays(
    targetCohortTable = "cohort2",
    indexDate = "cohort_start_date",
    targetDate = "cohort_start_date",
    window = list(c(-90, 90)),
    order = "last",
    nameStyle = "{cohort_name}_{window_name}_{value}"
  ) |>
  glimpse()
## Rows: ??
## Columns: 6
## $ cohort_definition_id <int> 1
## $ subject_id <int> 1
## $ cohort_start_date <date> 2020-02-01
## $ cohort_end_date <date> 2020-02-15
## $ cohort_1_m90_to_90_date <date> 2020-02-10
## $ cohort_1_m90_to_90_days <dbl> 9