`r lifecycle::badge("deprecated")`
Usage
plotCohortTiming(
  result,
  plotType = "boxplot",
  facetVarX = "variable_name",
  facetVarY = "group_level",
  colorVars = "group_level",
  timingLabel = "{cohort_name_reference} &&& {cohort_name_comparator}",
  uniqueCombinations = TRUE
)
Arguments
- result
A summariseCohortTiming result.
- plotType
Type of desired formatted table, possibilities are "boxplot" and "density".
- facetVarX
column in data to facet by on horizontal axis
- facetVarY
column in data to facet by on vertical axis
- colorVars
Column names to distinct by colors. default set to group_level
- timingLabel
A glue expression to identify each plotted cohort overlap.
- uniqueCombinations
If TRUE, only unique combinations of reference and comparator plots will be plotted.
Examples
# \donttest{
library(PatientProfiles)
cdm <- PatientProfiles::mockPatientProfiles()
timing <- summariseCohortTiming(cdm$cohort2)
#> Warning: `summariseCohortTiming()` was deprecated in PatientProfiles 0.8.0.
#> ℹ Please use `CohortCharacteristics::summariseCohortTiming()` instead.
#> ℹ The following estimates will be computed:
#> • days_between_cohort_entries: min, q25, median, q75, max
#> ! Table is collected to memory as not all requested estimates are supported on
#> the database side
#> → Start summary of data, at 2024-05-11 12:03:50.134341
#> ✔ Summary finished, at 2024-05-11 12:03:50.183368
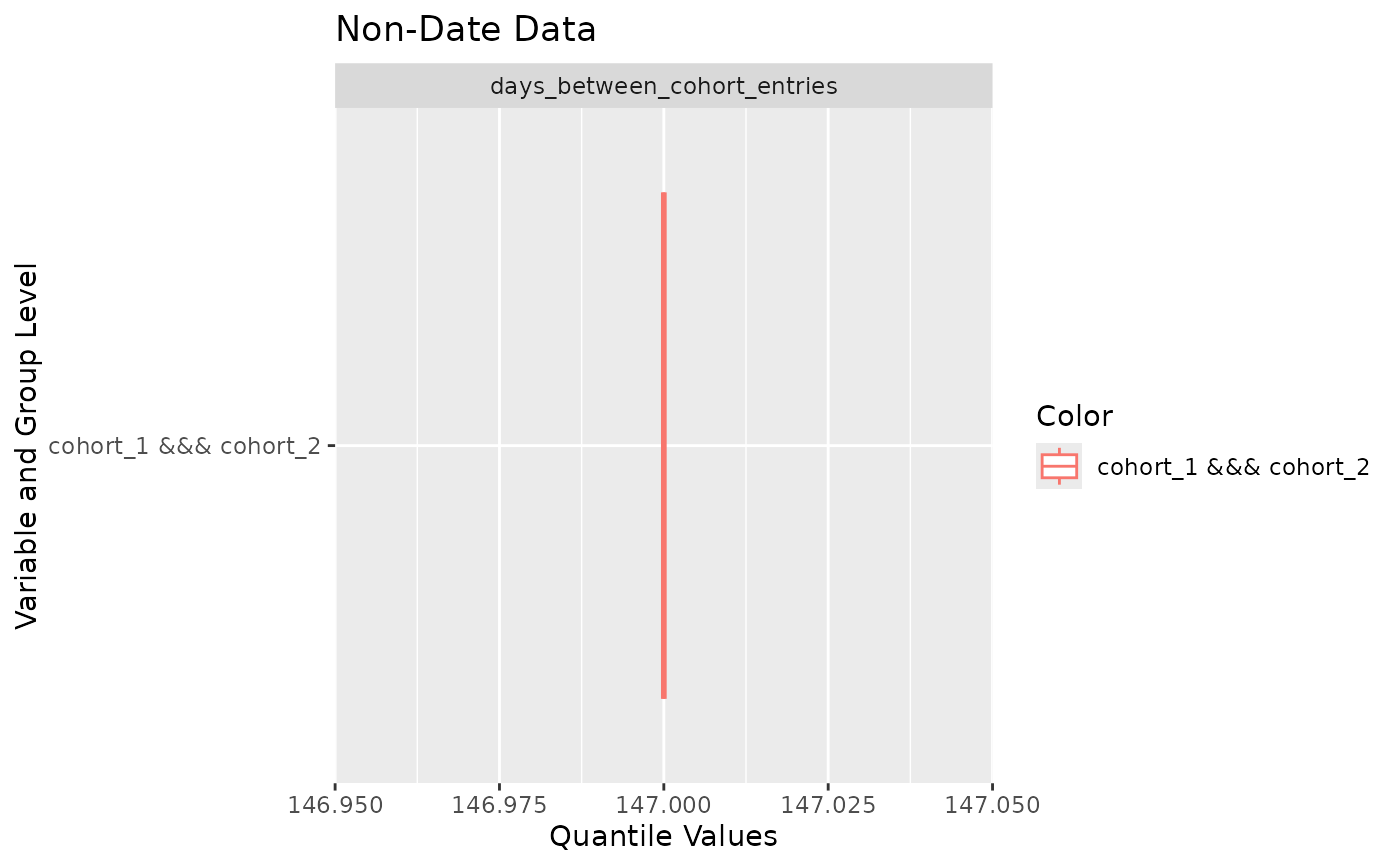
plotCohortTiming(timing)
 CDMConnector::cdmDisconnect(cdm = cdm)
# }
CDMConnector::cdmDisconnect(cdm = cdm)
# }