`r lifecycle::badge("deprecated")`
Usage
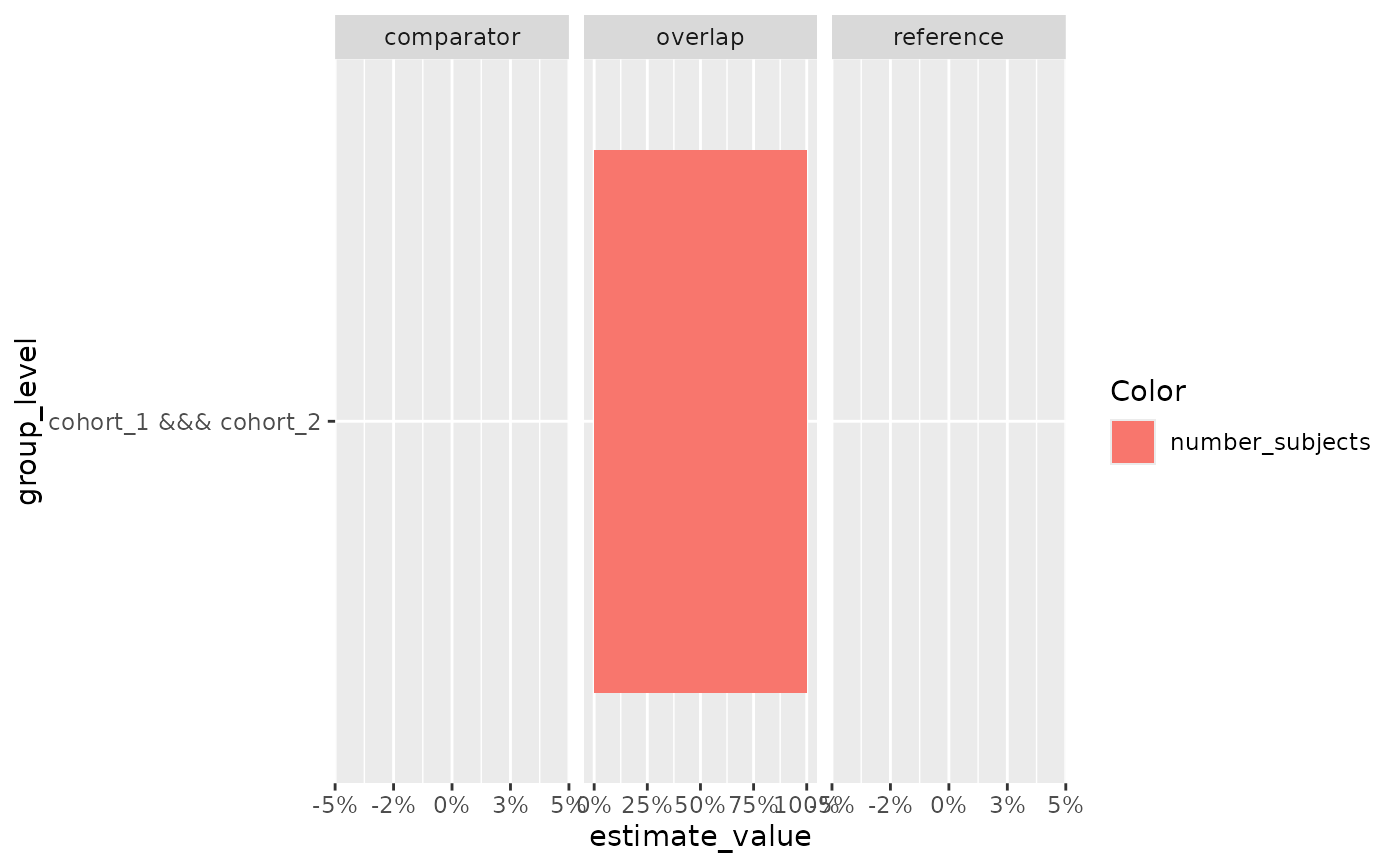
plotCohortOverlap(
  result,
  facetVarX = "variable_name",
  facetVarY = "strata_level",
  colorVars = "variable_level",
  overlapLabel = "{cohort_name_reference} &&& {cohort_name_comparator}",
  uniqueCombinations = TRUE
)
Arguments
- result
A summariseCohortOverlap result.
- facetVarX
column in data to facet by on horizontal axis
- facetVarY
column in data to facet by on vertical axis
- colorVars
column in data to color by
- overlapLabel
A glue expression to identify each plotted cohort overlap.
- uniqueCombinations
If TRUE, only unique combinations of reference and comparator plots will be plotted.
Examples
# \donttest{
library(PatientProfiles)
cdm <- PatientProfiles::mockPatientProfiles()
overlap <- summariseCohortOverlap(cdm$cohort2)
#> Warning: `summariseCohortOverlap()` was deprecated in PatientProfiles 0.8.0.
#> ℹ Please use `CohortCharacteristics::summariseCohortOverlap()` instead.
plotCohortOverlap(overlap)

# }
# }