Plot proportion of patients covered
Usage
plotProportionOfPatientsCovered(
  result,
  facet = "cohort_name",
  colour = strataColumns(result),
  ribbon = TRUE,
  style = NULL
)
Arguments
- result
A summarised_result object.
- facet
Columns to facet by. See options with
availablePlotColumns(result). Formula is also allowed to specify rows and columns.- colour
Columns to color by. See options with
availablePlotColumns(result).- ribbon
Whether to plot a ribbon with the confidence intervals.
- style
Visual theme to apply. Character, or
NULL. If a character, this may be either the name of a built-in style (seeplotStyle()), or a path to a.ymlfile that defines a custom style. If NULL, the function will use the explicit default style, unless a global style option is set (seevisOmopResults::setGlobalPlotOptions()) or a_brand.ymlfile is present (in that order). Refer to the visOmopResults package vignette on styles to learn more.
Examples
# \donttest{
library(DrugUtilisation)
cdm <- mockDrugUtilisation()
cdm <- generateDrugUtilisationCohortSet(cdm = cdm,
name = "my_cohort",
conceptSet = list(drug_of_interest = c(1503297, 1503327)))
#> ℹ Subsetting drug_exposure table
#> ℹ Checking whether any record needs to be dropped.
#> ℹ Collapsing overlaping records.
#> ℹ Collapsing records with gapEra = 1 days.
result <- cdm$my_cohort |>
summariseProportionOfPatientsCovered(followUpDays = 365)
#> Getting PPC for cohort drug_of_interest
#> Collecting cohort into memory
#> Geting PPC over 365 days following first cohort entry
#> -- getting PPC for ■■■■■■■■■■■ 119 of 365 days
#> -- getting PPC for ■■■■■■■■■■■■■■■■■■■■■■■■■■■ 313 of 365 days
#> -- getting PPC for ■■■■■■■■■■■■■■■■■■■■■■■■■■■■■■■ 365 of 365 days
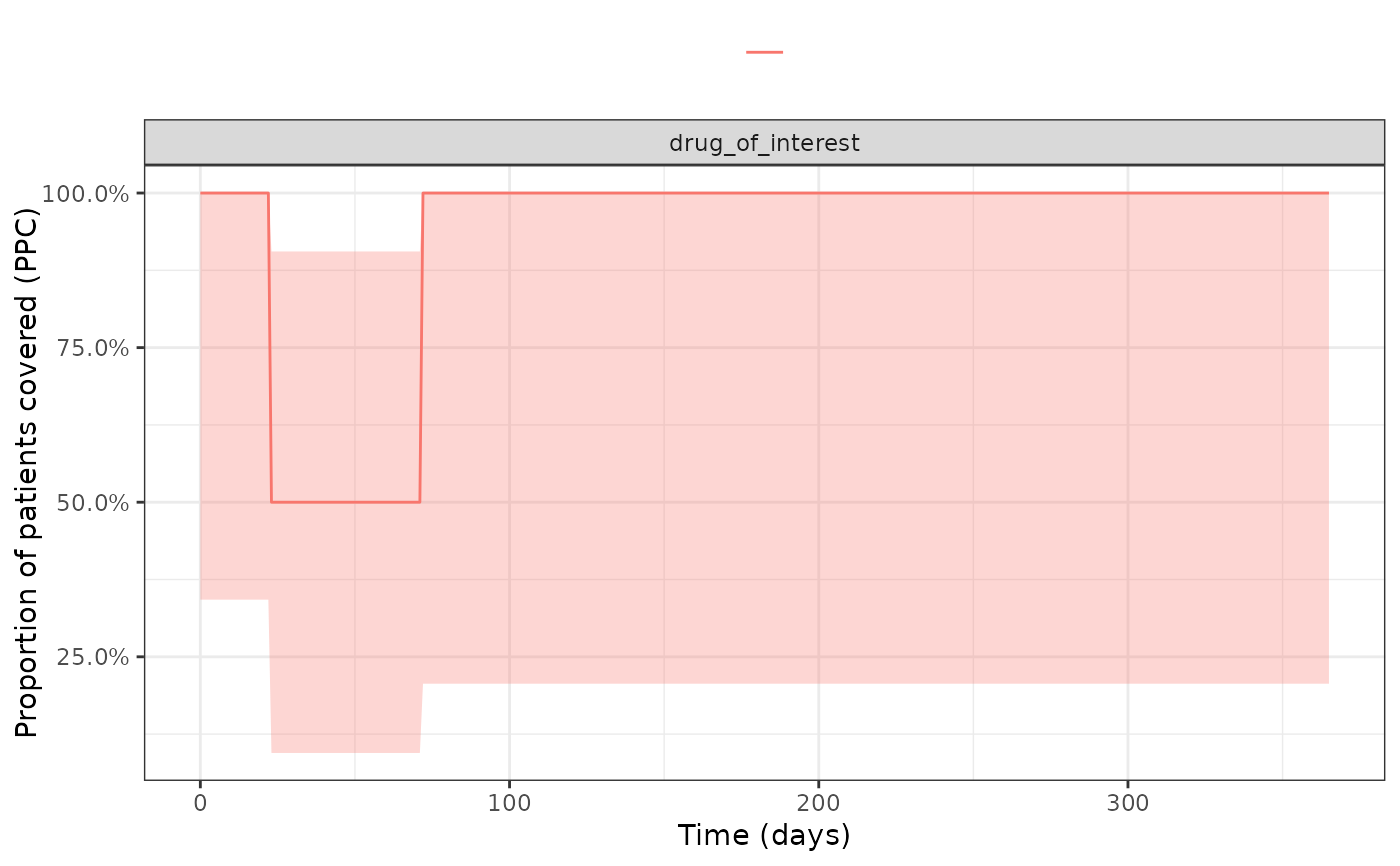
plotProportionOfPatientsCovered(result)
 # }
# }