Plot the time-specific estimates returned by estimateSingleEventSurvival()
or estimateCompetingRiskSurvival(). Single-event results are plotted as
survival probabilities by default and can be displayed as cumulative failure
with cumulativeFailure = TRUE. Competing-risk results are cumulative
incidence estimates and therefore require cumulativeFailure = TRUE.
Usage
plotSurvival(
  result,
  ribbon = TRUE,
  facet = NULL,
  colour = NULL,
  cumulativeFailure = FALSE,
  riskTable = FALSE,
  riskInterval = 30,
  logLog = FALSE,
  timeScale = "days",
  type = NULL,
  style = NULL
)
Arguments
- result
Survival results. A
summarised_resultorsurvival_resultis accepted.- ribbon
If TRUE, add a ribbon using the confidence interval columns.
- facet
Variables to use for facets.
- colour
Variables to use for colours.
- cumulativeFailure
Whether to plot the cumulative failure probability instead of the survival probability.
- riskTable
Whether to print risk table below the plot.
- riskInterval
Interval of time to print risk table below the plot. This should be compatible with the
eventGapused when estimating the result.- logLog
If TRUE, the survival probabilities are transformed using the log-log formula.
- timeScale
The scale of time in the x-axis. Can be "days", "months", or "years".
- type
Character string specifying the desired plot type. See
visOmopResults::scatterPlot()for supported types. Iftype = NULL, the default backend plot type is used.- style
A character string defining the visual theme to apply to the plot. You can set this to NULL to apply the standard ggplot2 default style, or provide a name for one of the package's pre-defined styles. Refer to the plotStyle() function for all available style pre-defined themes. For further customization, you can always modify the returned ggplot object directly.
Details
facet and colour should refer to columns available after converting the
result with asSurvivalResult(), for example target_cohort, outcome,
competing_outcome, variable, or strata columns such as sex.
Examples
# \donttest{
cdm <- mockMGUS2cdm()
#> Creating a new cdm
#> Uploading table person (1384 rows) - [1/7]
#> Uploading table observation_period (1384 rows) - [2/7]
#> Uploading table visit_occurrence (1 rows) - [3/7]
#> Uploading table death_cohort (963 rows) - [4/7]
#> Uploading table mgus_diagnosis (1384 rows) - [5/7]
#> Uploading table progression (115 rows) - [6/7]
#> Uploading table progression_type (230 rows) - [7/7]
surv <- estimateSingleEventSurvival(cdm,
targetCohortTable = "mgus_diagnosis",
outcomeCohortTable = "death_cohort")
#> ℹ Getting survival for target cohort 'mgus_diagnosis' and outcome cohort
#> 'death_cohort'
#> Getting overall estimates
#> `eventgap`, `outcome_washout`, `censor_on_cohort_exit`, `follow_up_days`, and
#> `minimum_survival_days` cast to character.
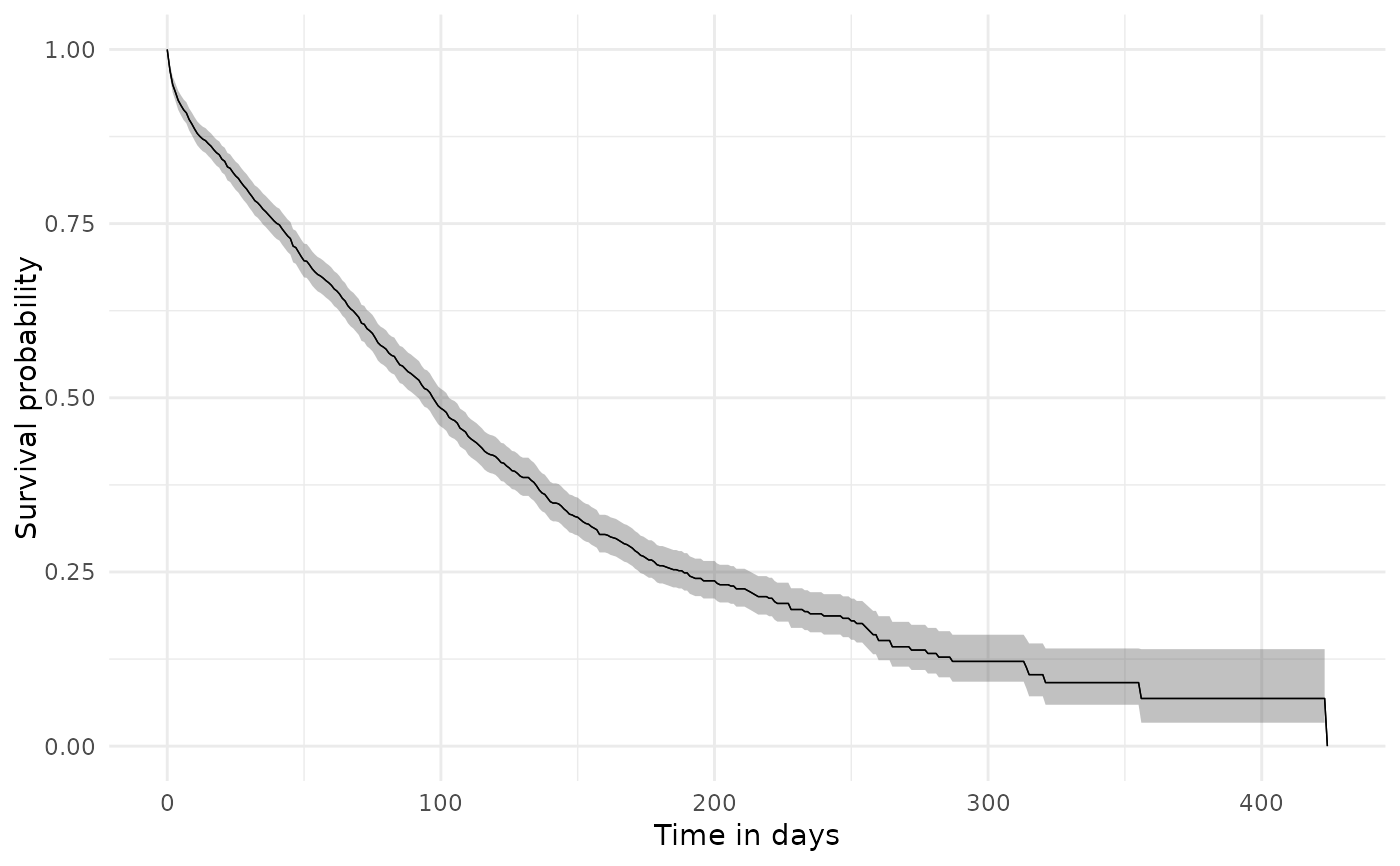
plotSurvival(surv)
#> Warning: eventgap column will be added to the survival result object to include all
#> relevant information
 # }
# }